
Store reports and analytics
Not "how much is in the till" but "how much did we earn": profit, turnover and stock levels in real time, from your computer or phone.
The consultation is free, with no strings attached
Skip the report hunt. Just ask X2
Type or say your question as it is: “what was revenue in September?”, “who owes us the most?”. X2 finds the number and answers right away, no need to dig for the right report. Available on the Expert plan.
More about Bai →Prefer the usual way? Reports in any breakdown are right below.
How it works
Sales are logged at the register
Every receipt carries items, cost price, discounts and payment method.
The numbers add themselves up
Revenue, markup, profit by product and category, with no Excel and no calculator.
Check from anywhere
In a browser or the app: open your phone in the morning and see how the store did yesterday. On the Expert plan you can just ask Bai in the chat.
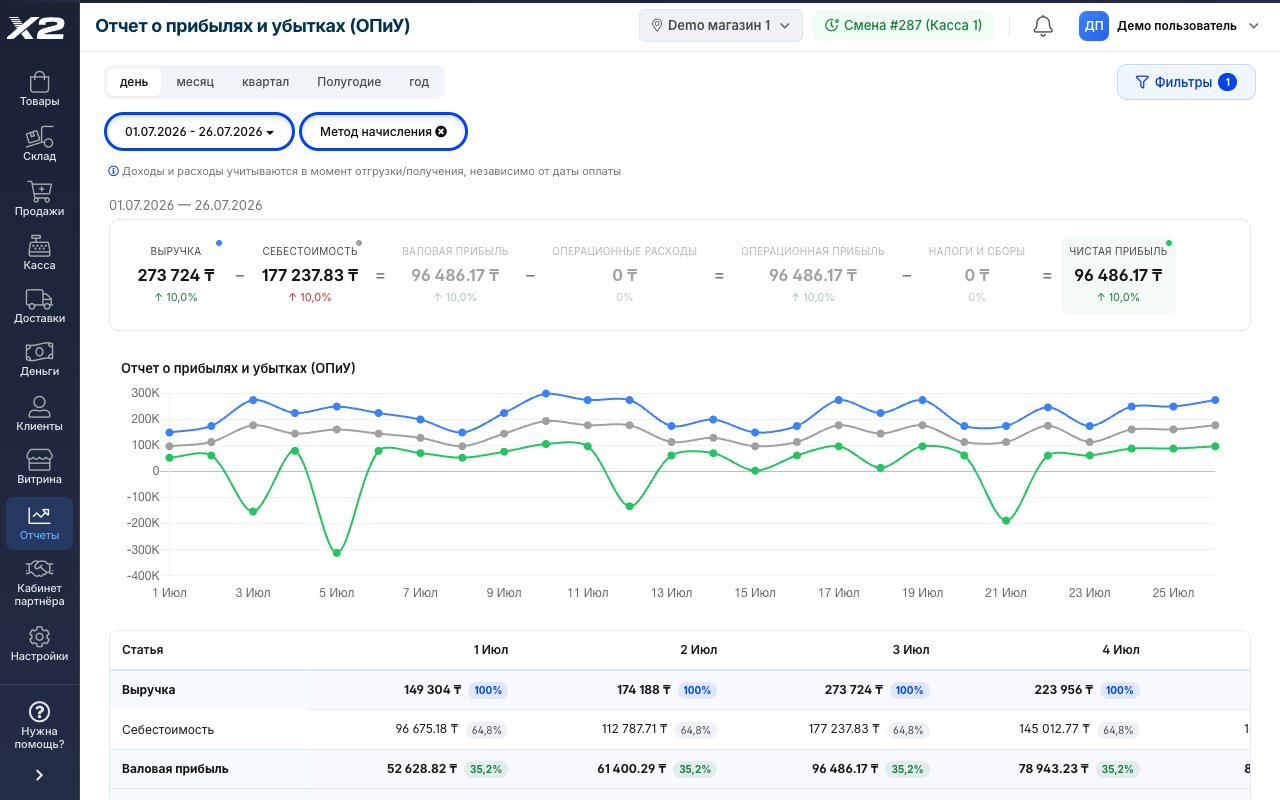
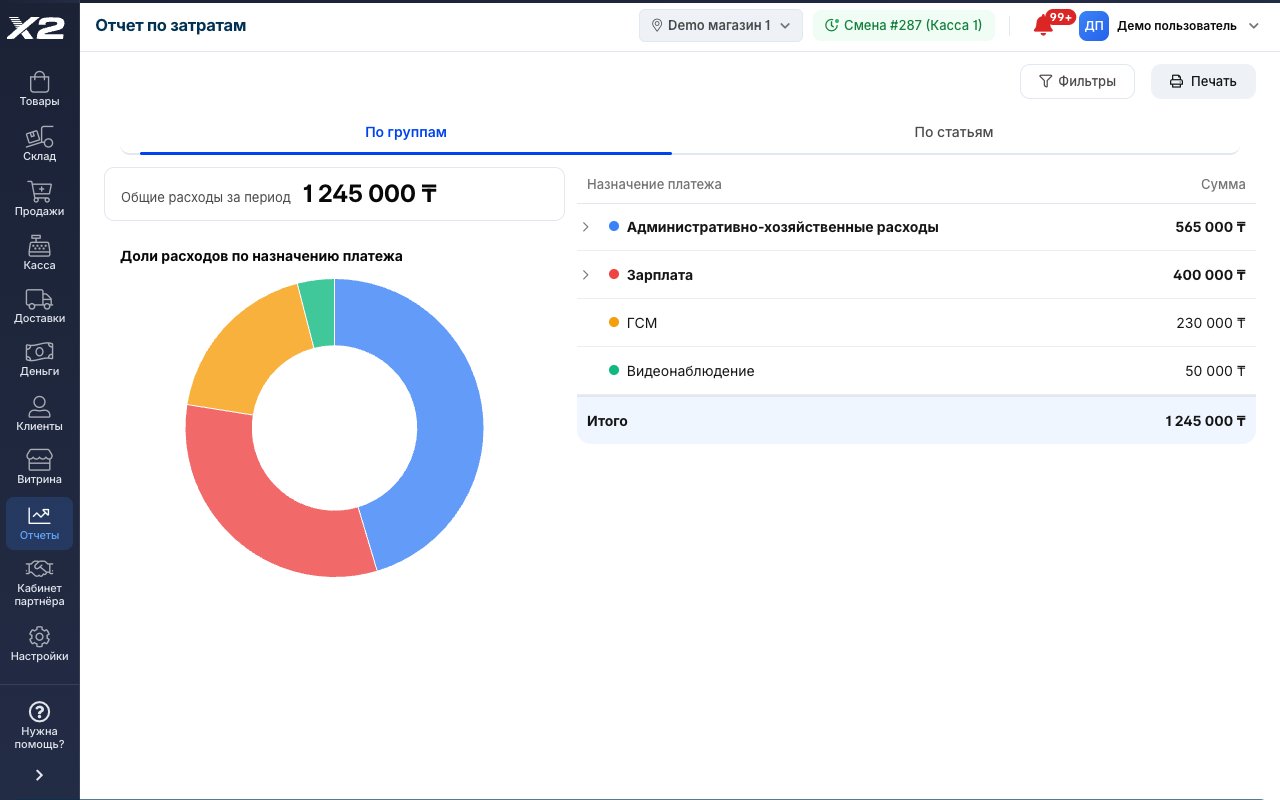
Expenses by category and an honest P&L
- Rent, payroll, ads: every expense is logged under its category
- The chart shows which category eats the most money
- Expenses flow into the P&L: profit is honest, not just "cash in the drawer"
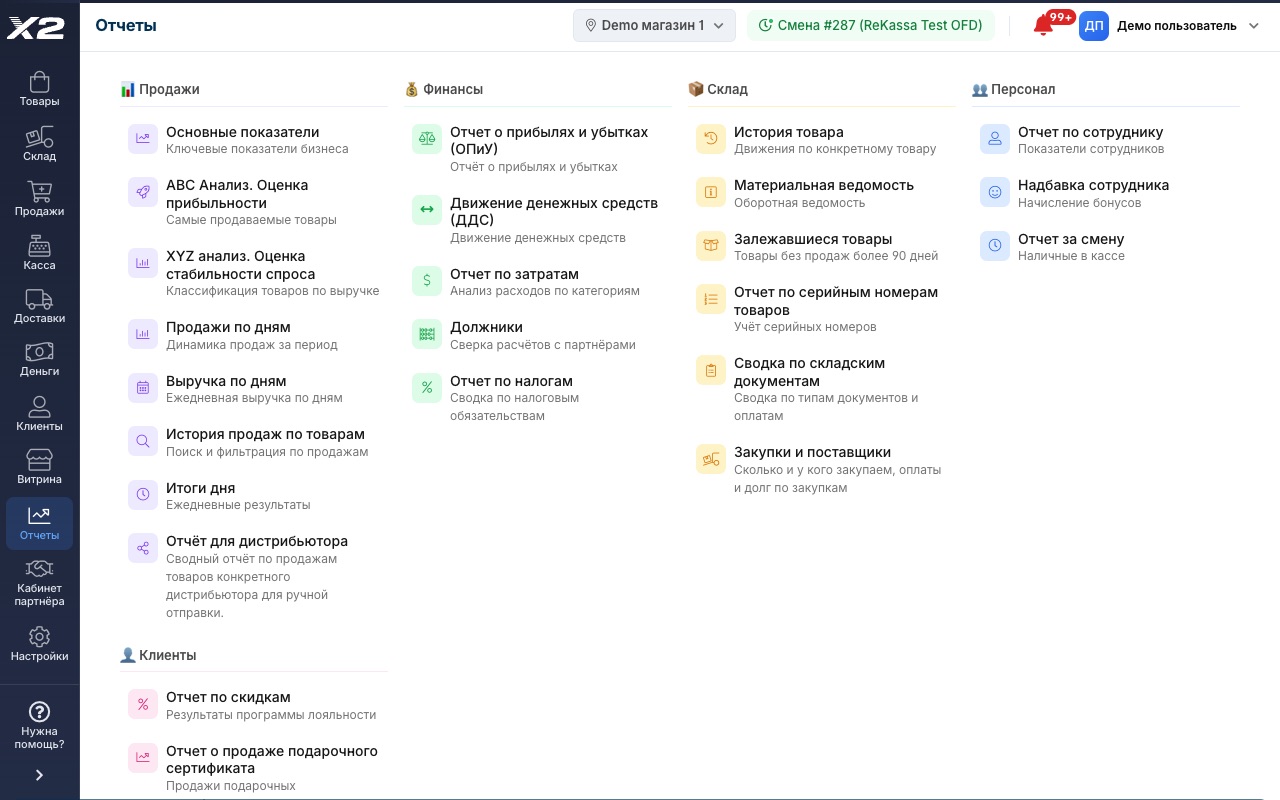
A ready-made report for every question
- Sales, finance, stock, staff and customers: 20+ reports by section
- Any period: a day, a month, a quarter or your own date range
- Every report exports to Excel in one click
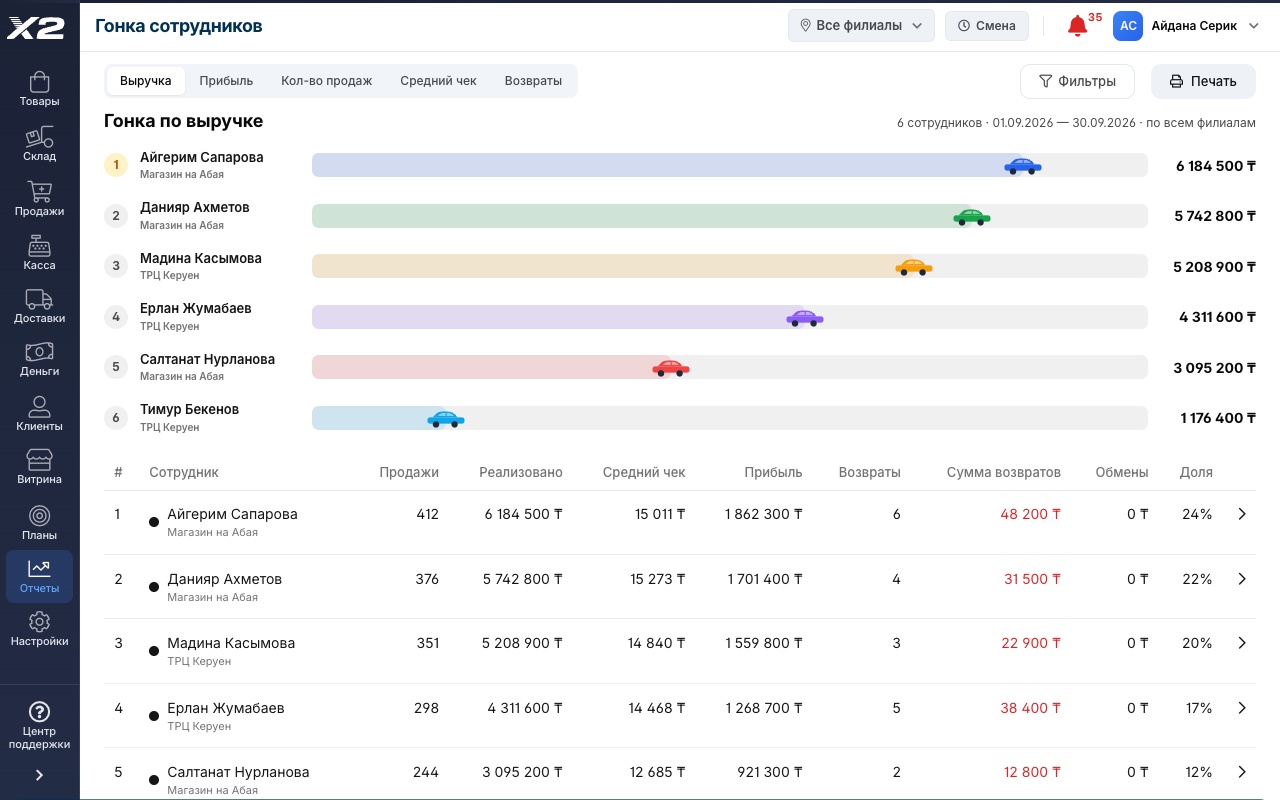
Staff race
- Sellers compete like on a racetrack: whoever’s car is ahead sold the most this month
- Race by revenue, profit, number of sales, average check and returns
- Click a person to open their sales and returns
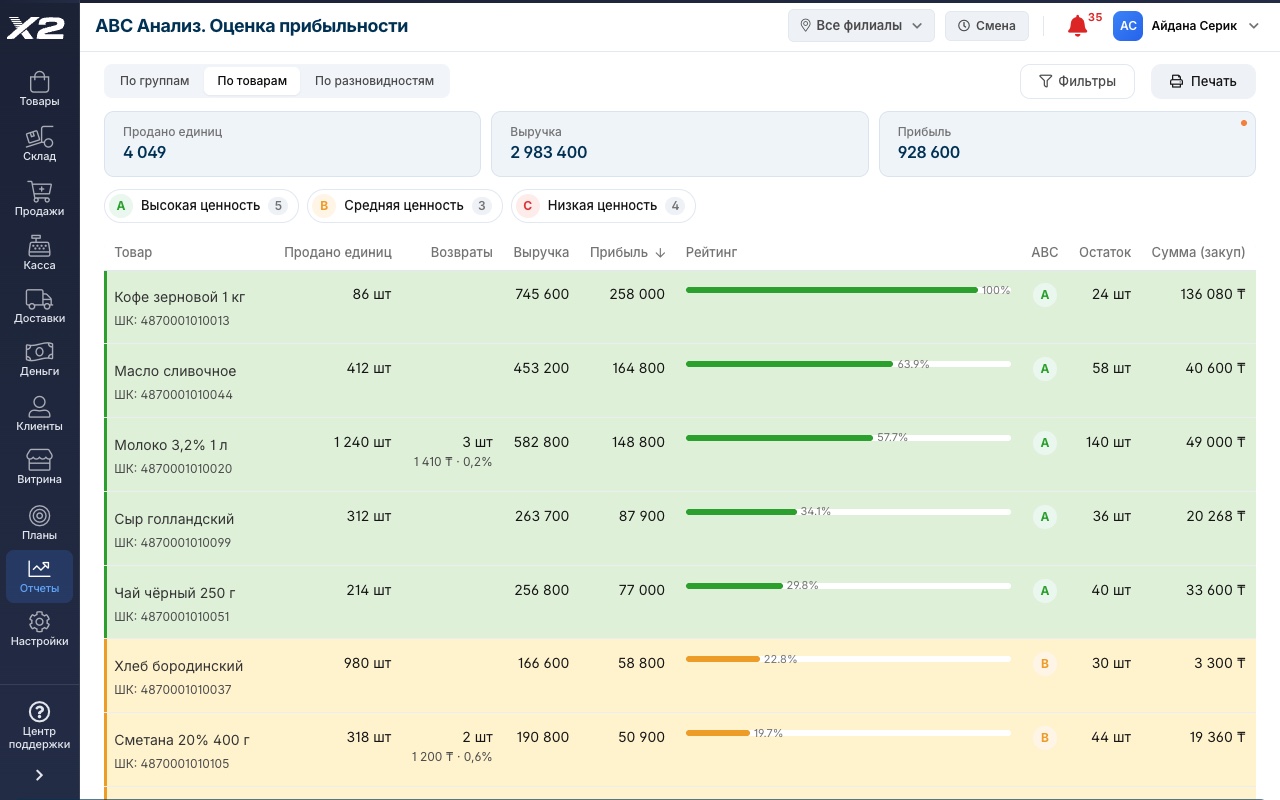
ABC analysis: where your profit comes from
- Group A: the products that bring most of your profit
- Group C: dead stock that takes up shelf space and ties up cash
- Break it down by groups, products and variants
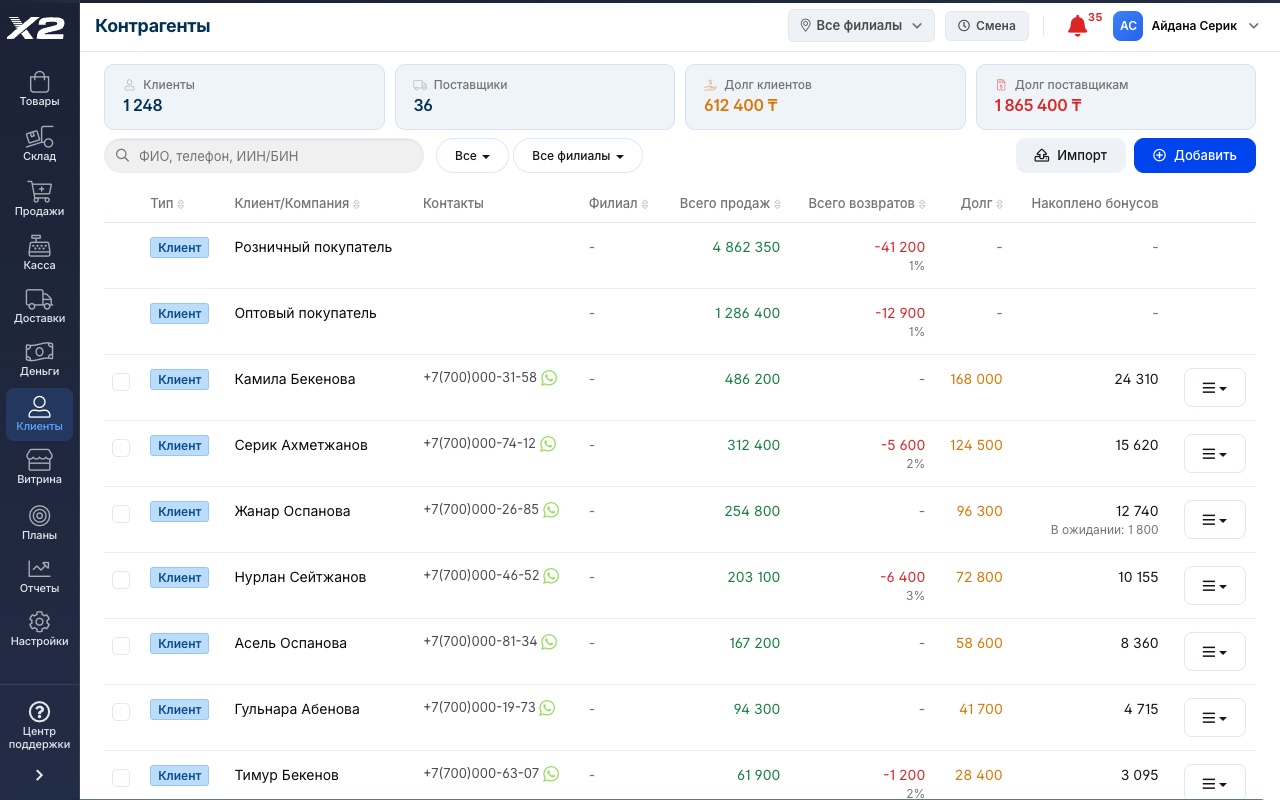
Customer and supplier debts under control
- See who owes you and whom you owe: in total and per partner
- Settlement history per partner: sales, payments, returns
- A reconciliation act is generated from the app in a minute
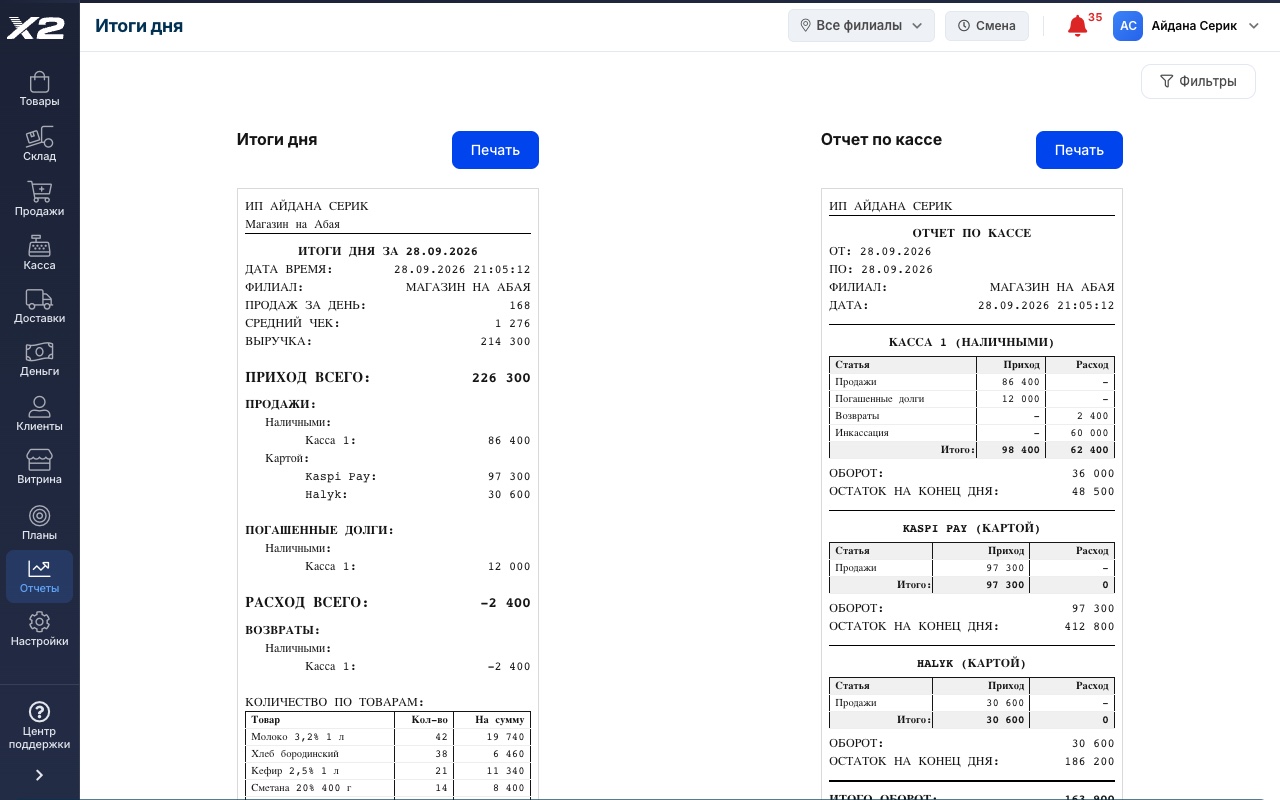
Daily results add themselves up
- Revenue, average receipt and sales count for the day on one sheet
- Cash register report: cash, inflow and outflow per shift
- One-click printing: a daily journal to keep your paperwork in order
P&L: profit and loss
The owner's main report: revenue, cost of goods, expenses and net profit by month.
Sales from every angle
By product, category, salesperson, hour and payment type: you see what actually drives revenue.
Purchasing and suppliers
How much you buy and from whom, payments and purchasing debt. See which suppliers your range depends on.
Stock value in money
How much money is tied up in inventory and which products are dead weight.
Debts and settlements
Which customers owe you and whom you owe, per counterparty, with history.
Fast movers
The program highlights what sells fastest. Restock in time and stop losing revenue to an empty shelf.
ABC/XYZ analysis
The program splits your range into leaders and dead weight: see what drives revenue steadily and what only sells by chance.
Money stuck in the business
Stock that hasn’t sold in months and customer debts: X2 shows how much money is frozen in them.
Seller bonuses
Set a percentage of sales per product, and X2 works out each seller’s bonus.
Frequently asked questions
Will I see profit or only revenue?
Profit. The system knows the purchase price of every unit sold, so it calculates markup and net profit, not just turnover.
Can I view reports on my phone?
Yes, in the X2 POS app or your phone's browser: daily sales, shifts, stock levels and profit, wherever you are.
Can I see sales per cashier?
Yes: revenue, receipt count and average receipt per employee. Great for motivation and shift control.
How do I hand the data to my accountant?
Two ways. Give your accountant access to X2 with the Accountant role: they check the reports they need and can’t change anything, the role is view only. Or export any report to Excel in one click and send the file.
Do reports update in real time?
Yes. A receipt closes at the register, and a second later it's in the reports. No "yesterday's exports".
See it live in a 15-minute demo
We'll walk you through it using your own store and your own products. Free, with no strings attached.
4300+ stores run on X2 POS · 8 years on the Kazakhstan market · ★ 4.9 rating on 2GIS · 60 reviews